
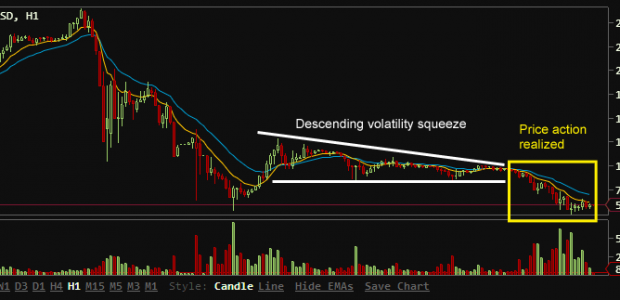
As noted in our post yesterday, a major volatility squeeze was signaling a breakout move with a bias towards the downside for BTC exchange rates. Based on the range of the descending triangle pattern analyzed, we predicted a breakout downwards with the same magnitude of $25-40 from the $95 at the time of the post. BTC has since bounced from a bottom of $49 to stabilize near $60.
We expect $49 to serve as strong support, having been tested three times since mid-March and not yet breached. Overhead resistance from a mixture of marginal profit taking and fear-driven selling by those who bought shortly before or after the correction last week is expected to support an upward bound near $65, as has been tested since the most recent bottom. Given the $49-65 range, our bias is towards the upside. If $65 is passed, expect $85 to serve as the next resistance as provided by the last few days’ triangle pattern. If $49 is breached, expect heavy panic selling with a reversion to the mid-30s, pre-hype levels.




Right again!
Indeed. $65 was tested a couple times before the breakout. I lacked adequate time to write another update, but you’ll notice yet another triangle pattern formed to test $65 with an increasing lower bound before jumping to the high 70s. It’s proving to be one of the most consistent patterns in BTC trading.
aaaand back down
The fun part about predictive patterns is that they’re only useful until realized.