
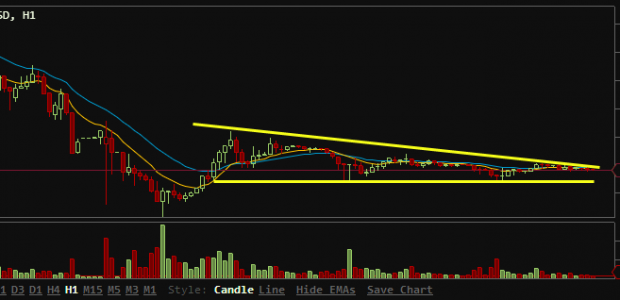
BTC/USD has been trading in an increasingly tight band recently. Notably, support at $85 has been repeatedly tested while upper bounds continue to deflate. The descending triangle pattern would generally indicate a large move is imminent, in this case pointing towards the downside. We wouldn’t be surprised to see a drop equivalent to the size of the triangle in the $25-40 range from the current $95 exchange rate, particularly if the $85 lower bound is breached.


You called it, well ahead of time. And saved me some money (I sold an hour before the current correction began)
Now let’s see what the new bottom will be.
Happy to be of service.
Please set up a mailing list I’d like to subscribe
We will look into setting that up. In the mean time, I recommend following us on Twitter – all updates are currently posted there. Cheers.
Nice job.
Thank you, kind sir.
Correction reversed, it’s about to break 120.